Getting Started
Module 3: Technical Analysis
Welcome to Module 3! This is where you’ll learn the core of naked forex trading (trading without indicators) —using technical analysis to read price movements and make precise trading decisions. This module breaks down the tools you’ll use to identify setups, time your entries on 15-minute charts, and plan your exits at key 4-hour or daily levels. We’ll focus on practical strategies that can be applied to various situations in the marketplace.
Order Types
Understanding order types is essential for executing trades effectively. This is how you’ll enter, exit, and manage risk in the forex market.
Market Order:
Executes immediately at the current market price.
Best for fast entries when you want to join right away.
Pros: Instant execution.
Cons: May face slippage (a sudden spread change before execution)
Example: EUR/USD is at 1.1000, and you place a market order to buy. You enter at the current price, around 1.1000.
Limit Order:
Sets a specific price to buy or sell, executed only if the market reaches that price.
Ideal for entering trades at precise levels (e.g., buying right at a specific level) Pros: Ensures your desired price; no slippage.
Cons: May miss the trade if the price doesn’t reach your level.
Example: You set a limit order to buy EUR/USD at 1.0980, a key support level. The trade triggers only if the price hits 1.0980.
Stop Loss:
An order to close a trade at a set price to limit losses.
Critical for risk management in every trade.
Example: You buy EUR/USD at 1.1000, setting a stop loss at 1.0985 (15 pips below). If the price drops, your trade closes to cap the loss.
Tip: Place stop losses below support (for buys) or above resistance (for sells) to avoid being stopped out prematurely.
Stop Limit:
Combines a stop order and a limit order. Triggers a limit order when a stop price is hit.
Used for precise exits in volatile markets but less common in fast-paced day trading.
Example: You set a stop limit to sell EUR/USD if it drops to 1.0980 (stop price), with a limit to sell at 1.0975. If triggered, it tries to sell at 1.0975 or better.
Cons: May not execute if the market gaps past your limit price.
Your Strategy Connection: For solid entries, you’ll likely use limit orders to enter at precise support/resistance levels on 15-minute charts and stop losses to protect every trade. Market orders are useful for quick entries during strong momentum.
Price Action Basics
Price action is the heart of naked forex trading—reading raw price movements without indicators. It’s about understanding what the market is telling you through candlestick patterns, trends, and key levels.
What is Price Action?:
The study of price movements on a chart to predict future direction.
Focuses on patterns, momentum, and levels (support/resistance) rather than indicators like moving averages.
Why It Matters: Price action reflects the collective behavior of market participants (banks, hedge funds, etc.) giving you clues to trade profitably.
Key Principles:
Momentum: Use daily/4-hour charts to identify the market’s direction (uptrend, downtrend, or range). Trade in the direction of momentum for higher-probability setups.
Rejections: Look for price rejecting (bouncing off/leaving wicks) at key levels, signaling potential entries or exits.
Confluence: Combine multiple signals (e.g., a candlestick pattern at a support level combined with session times, candle closes, ) for stronger setups.
Your Approach:
Analyze daily/4-hour charts to identify momentum and key levels.
Use 15-minute (or lower) charts for precise entries.
Exit at the next 4-hour or daily support/resistance (depending on market conditions), targeting 10–15 pips or 40+ pips if momentum is strong.
Example: On a 4-hour EUR/USD chart, you see an uptrend with price approaching a resistance at 1.1050. On the 15-minute chart, you spot a rejection (a candlestick with a long wick) at 1.1050, signaling a potential sell. You enter a short trade with a stop loss above 1.1060 (prior highs) and aim for a 10-pip profit at 1.1040.
Support & Resistance (and How to Draw Levels)
Support and resistance are the backbone of price action. These are price levels where the market tends to reverse or pause due to supply/demand dynamics aka “order flow”.
Support:
A price level where buying interest prevents further declines (a “floor”).
Example: EUR/USD repeatedly bounces off 1.0950 on a daily chart, indicating strong support.
Resistance:
A price level where selling pressure halts upward moves (a “ceiling”).
Example: GBP/USD struggles to break above 1.3000 on a daily chart, showing resistance.
How to Draw Support/Resistance Levels:
Use Higher Timeframes: Focus on daily and 4-hour charts to identify significant levels where price has reversed or consolidated multiple times.
Look for Swing Highs/Lows:
Support: Find areas where price bounced upward after hitting a low (e.g., a series of lows around 1.1000).
Resistance: Find areas where price reversed downward after hitting a high (e.g., highs around 1.1100).
Draw Horizontal Lines:
Use TradingView to draw lines connecting multiple touches of a price level.
A level is stronger if price has tested it multiple times (3+ touches), the more touches the stronger the level. The higher the time frame the stronger the level. (Multiple touches on the Daily is stronger than the 4HR). Daily > 4HR > 1HR > 15 Min
Zones, Not Lines: Treat levels as zones (e.g., 1.0995–1.1005) rather than exact targets, as markets rarely reverse precisely.
Confirm with Price Action: Look for candlestick patterns (below) or rejections at these levels to validate them.
Trading Application:
Buy at support in an uptrend, sell at resistance in a downtrend.
Use 15-minute charts to time entries when price retests these levels.
Exit at the next 4-hour or daily level, or use a trailing stop for bigger moves (40+ pips) if conditions are favorable.
Candlestick Patterns
Candlesticks are the building blocks of price action, telling the story of how price moves over time. Each candlestick represents a timeframe (e.g., 15 minutes) and displays the open, high, low, and close prices. Certain patterns signal potential reversals or continuations, signaling when to enter/exit your trades.
Key Candlestick Patterns:
Pin Bar:
A candle with a small body and a long wick (tail), showing rejection of a price level.
Bullish Pin Bar: Long lower wick at support, signaling buying pressure (potential buy).
Bearish Pin Bar: Long upper wick at resistance, signaling selling pressure (potential sell).
Example: A bearish pin bar on a 15-minute EUR/USD chart at 1.1050 resistance confirms a short entry.
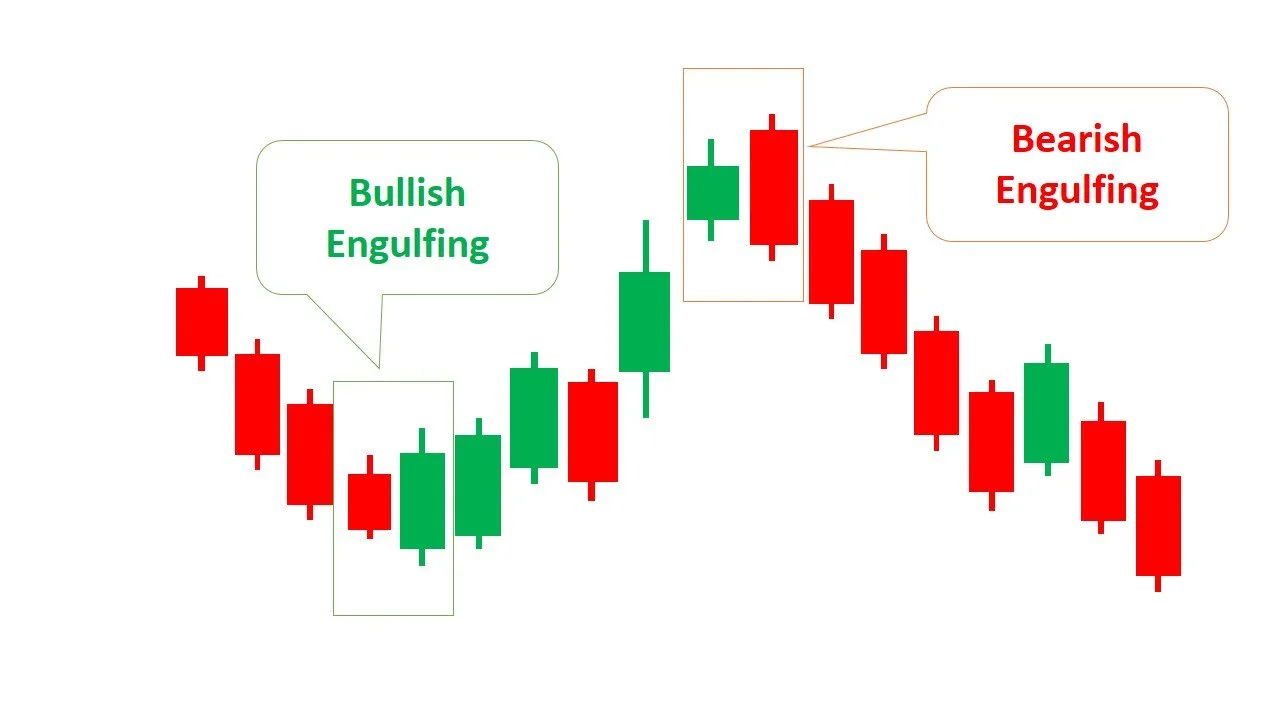
Engulfing Pattern:
A two-candle pattern where a small candle is followed by a larger candle that “engulfs” it.
Bullish Engulfing: At support, signals a potential reversal up (buy).
Bearish Engulfing: At resistance, signals a potential reversal down (sell).
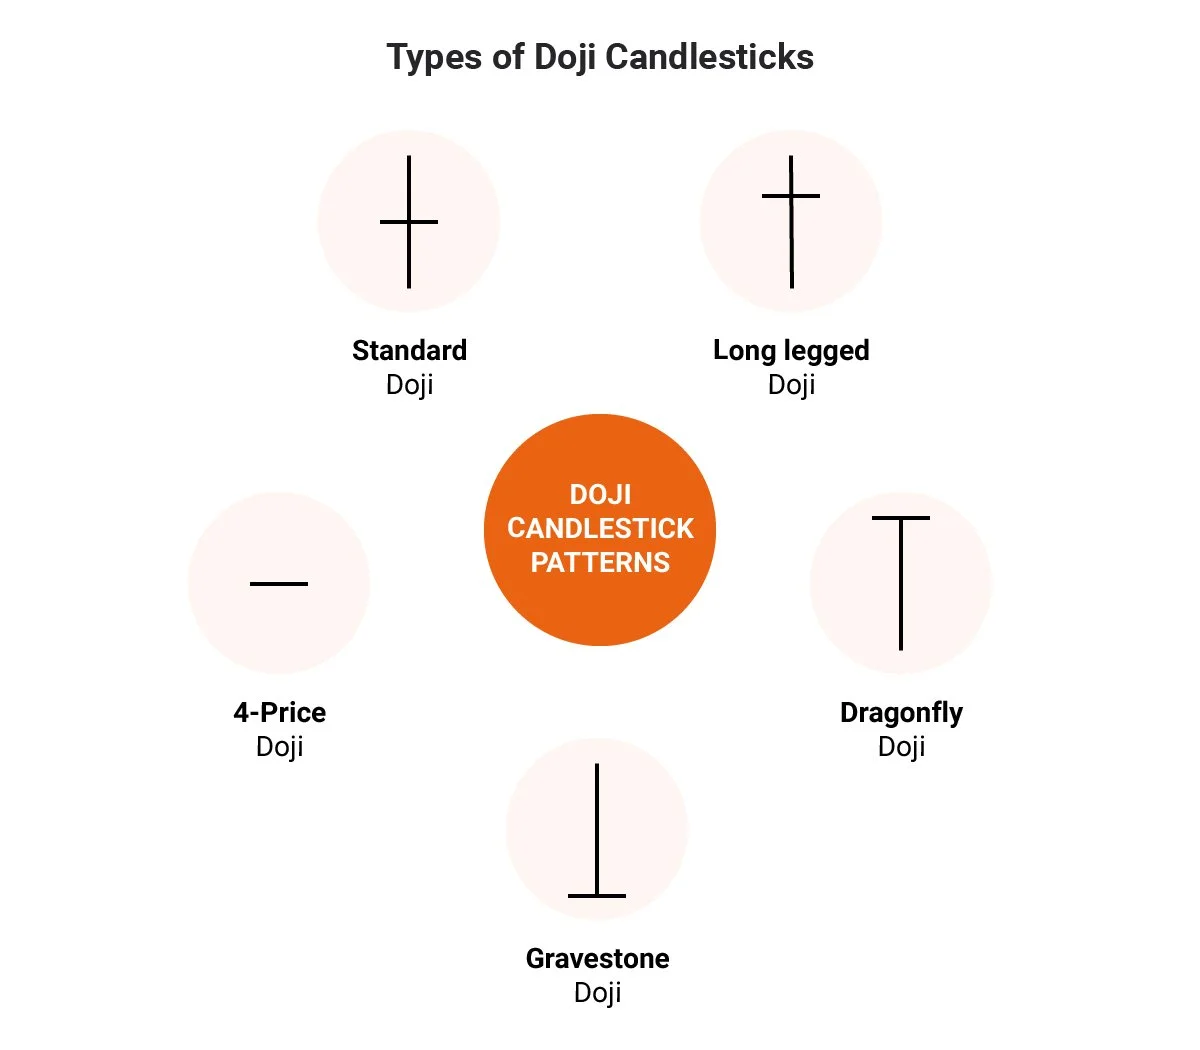
Doji:
A candle with a tiny body (open ≈ close), indicating indecision.
Stronger when it appears at support/resistance, signaling a potential reversal.
Example: A doji at a 4-hour support level on USD/JPY suggests a bounce, confirmed by a 15-minute bullish candle.
How to Use:
Look for patterns at key support/resistance levels on daily/4-hour charts.
Confirm entries on 15-minute charts when these patterns form.
Always set a stop loss beyond the pattern’s high/low to manage risk.
Pro Tip: Don’t overcomplicate—focus on pin bars and engulfing patterns at strong levels for high-probability setups. Avoid trading patterns in the middle of a range without support/resistance confluence. Always take your trades at key areas of interest, NOT between.
Trendlines and Channels
Trendlines and channels help you visualize market direction and momentum, providing insight into the structure of the market.
Trendlines:
Lines connecting swing highs (in a downtrend) or swing lows (in an uptrend).
Uptrend: Connect higher lows to show rising momentum. Buy near the trendline in an uptrend.
Downtrend: Connect lower highs to show falling momentum. Sell near the trendline in a downtrend.
How to Draw:
Identify at least 2–3 swing points (higher lows or lower highs).
Draw a line connecting these points on a 4-hour or daily chart.
Test the trendline: It’s valid if price respects it (bounces or reverses).
Channels:
Two parallel trendlines forming a price range (like a tunnel).
Ascending Channel: Uptrend with higher highs and higher lows. Buy at the lower trendline (support), sell at the upper (resistance).
Descending Channel: Downtrend with lower highs and lower lows. Sell at the upper trendline, buy at the lower.
Horizontal Channel: Sideways market (range). Buy at support, sell at resistance.
How to Draw: Draw a trendline, then add a parallel line touching the opposite swings (highs or lows).
Trading Application:
Use daily/4-hour trendlines to confirm momentum direction.
Enter on 15-minute charts when price retests a trendline or channel boundary with a candlestick pattern (e.g., pin bar).
Exit at the next support/resistance level or opposite channel boundary, targeting 7–15 pips or more if momentum persists.
Example: In an ascending channel on a 4-hour GBP/USD chart, price bounces off the lower trendline at 1.2950 with a bullish pin bar on the 15-minute chart. You buy with a stop loss below 1.2935, targeting 1.2970 (10 pips) or the upper channel line at 1.3000 (40+ pips).
Key Takeaways
Order Types: Use limit orders for precise entries at support/resistance, stop losses to manage risk, and market orders for quick entries. Stop limits are less common but useful in volatile markets.
Price Action: Read raw price movements to identify momentum and reversals, focusing on daily/4-hour charts for direction and 15-minute charts for entries.
Support/Resistance: Draw levels on higher timeframes as zones where price reverses or pauses. Trade retests with price action confirmation.
Candlestick Patterns: Focus on pin bars, engulfing patterns, and dojis at key levels for high-probability setups.
Trendlines/Channels: Use to confirm momentum and trade bounces or breaks, entering at trendline retests and exiting at key levels.
Your Edge: Combine price action (candlesticks) with support/resistance and trendlines on 15-minute charts to time entries, exiting at the next 4-hour/daily level for consistent profits. Use multiple time-frames to establish momentum and determine entries/exits. Discipline is key—don’t chase trades outside your strategy.